Weekly Market Outlook for Subscribers: Key Levels, Trends & Trading Scenarios
Navigating the Week Ahead: Will We Breakout or Breakdown?
- Last week mirrored the prior week—a deep dip followed by a strong recovery.
- This pattern suggests buyers are still stepping in aggressively on pullbacks, preventing a true breakdown.
- If this continues, it signals underlying strength in the market.
- However, we are at a pivotal juncture where the next move could define the broader trend: will we see a breakout after two weeks of consolidation, or a breakdown if buyers finally lose control?
Let’s break it all down with key levels, scenarios, and trading insights to prepare for the week ahead.
---
📊 Weekly Market Structure & Pivots
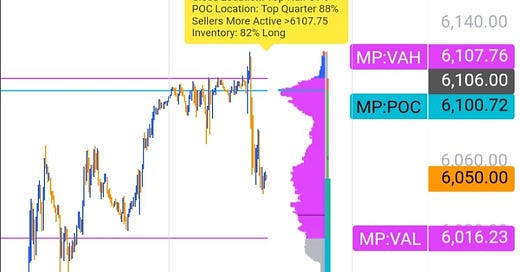
🔸 $ES Weekly Pivot: 6016
🔸 $NQ Weekly Pivot: 21394
These pivots represent intraday balance levels where price action is likely to gravitate. Whether we close above or below these pivots by the end of the week will provide key insights into whether the market is basing for a breakout or a deeper move lower.
---
🚀 Key Levels & Scenarios to Watch
Upside Potential: Breakout Watch
✅ 6130 ($ES) / 21149 ($NQ) – Key Resistance & Bullish Breakout Levels
- If buyers defend the weekly pivots (6016 for ES, 21394 for NQ), we could see a push to these levels.
- Holding above these targets could lead to continued strength into next week, confirming a sustained recovery.
- Beyond 6130, next major upside target is 6180-6200 for ES and 21750+ for NQ.
Downside Risks: Breakdown Watch
🔻 5935 ($ES) / 20971 ($NQ) – Key Support & Breakdown Levels
- If price fails to hold the weekly pivots, especially on a daily close basis, it suggests sellers are regaining control.
- Losing 5935 ($ES) and 20971 ($NQ) would confirm a shift toward a deeper correction, with the next major downside targets near 5860 for ES and 20500 for NQ.
---
🎯 Scenarios to Watch for This Week
🔹 Bullish Case – Breakout from Consolidation
- If we hold above 6016 ($ES) and 21394 ($NQ) early in the week, expect continued strength with upside targets at 6130+ for ES and 21149+ for NQ.
- Buyers stepping in aggressively on dips would confirm accumulation at support, making breakouts more likely.
- Look for a move above 6130 on $ES and 22149 on $NQ to trigger further upside momentum.
🔹 Bearish Case – Breakdown After Two Weeks of Failing to Breakout
- If sellers push price below 6016 ($ES) and 21394 ($NQ) early in the week, it could trigger a larger downside move.
- Key warning sign: If price fails to reclaim these pivots after breaking below, this would confirm a shift in control to sellers.
- Losing 5935 ($ES) and 20971 ($NQ) is a red flag for further downside, targeting 5860 ES / 20500 NQ.
---
📚 Educational Insight: Recognizing the Difference Between Accumulation & Distribution
The last two weeks have been range-bound, with large dips followed by recoveries. This could either be:
1️⃣ Accumulation (Bullish): Buyers are soaking up supply at key support levels, preventing breakdowns. This often leads to a strong upside breakout once resistance is cleared.
2️⃣ Distribution (Bearish): Large players are offloading positions into strength, creating temporary rallies before the real breakdown happens.
How to Tell the Difference?
- Watch key support levels closely. If buyers keep reclaiming dips, it’s likely accumulation.
- Monitor volume. Higher volume on rallies than on sell-offs suggests real buying interest.
- Look for exhaustion signals. If price keeps rejecting resistance (6130 ES / 21149 NQ) without follow-through, it could indicate distribution.
---
📌 Final Thoughts: How to Trade This Week
🔹 Pay close attention to 6016 ($ES) and 21394 ($NQ). These pivots define the battle zone between bulls and bears.
🔹 Stay flexible. This market is still volatile, and a fake move in one direction could lead to a powerful reversal.
🔹 Wait for confirmation. If we lose support levels, don’t blindly buy dips—wait for price to reclaim before jumping in.
---
🚀 Key Takeaways
📌 6130+ ($ES) / 21149+ ($NQ) → Bullish breakout potential
📌 5935 ($ES) / 20971 ($NQ) → Major downside risk if lost
📌 6016 ($ES) / 21394 ($NQ) → Pivot zone that determines trend
This week is crucial—stay sharp, trade the plan, and let price action confirm the next big move!


